Navigation

5 January 2015

Global Stock Markets Performance 2014

Global Stock Markets

The global stock markets as a whole have been enjoying bullish years on the back of Central Bank monetary expansion. Since September of this year, however, stock markets in aggregate have been weakening and were unable to push to new highs. These could be regarded as signs of topping out and may portend more difficulty ahead for national markets. Although, divergence is a theme that is likely to embolden in the new financial year.

Global Stock Market Performance
S&P Global 1200: + 3.49% {source}
The same chart pattern can be noted on the MSCI World Index, which failed to push higher since July 2014. Initials lows and subsequent highs in the beginning 2015 will be very indicative of stock market health moving forward.

Global stock market performance
MSCI World Index {source}

Global stock market performance
Bloomberg EMEA World: -8.49% {source}

The Bloomberg EMEA-World Index even has shown a stronger bearish  inclination and could be further down the formation of a top. The primary bullish trend is still formally in place (-8.49%), but bare in mind that a decline of 20% or more is generally considered bear market territory.


Outperforming Stockmarket 

Venezuela

For the second year in a row, the absolute king of the stock markets was found in Latin America. While Venezuela gained a whopping 447% in 2013, Argentina 'only' had to settle for a +61.24% gain on the Merval Index in 2014.

Argentina stock market performance
Argentina Merval Index: +61.24% {source}


To harmonise data, realised gains in Argentina should be adjusted for high inflation rates. Although their actual inflation rate is clouded in obscurity (and under suspicion of manipulation), a yearly inflation rate of at least 10% should be discounted.

China - Shanghai

Second in place is China, whose Shanghai Stock Exchange (Shanghai Composite) appreciated an elegant 56.8% over the course of 2014. To be more precise, in the latter part (quarter) of the year, as China profited from better connected stock exchanges, an influx of local retail investors and a fresh bout of monetary stimulus.
China stock market performance
SSE Index (Shanghai Composite): +56.8% {source}

Underperforming Stock Market

The Russian Federation

The biggest losses can be attributed to the most dogged down nation of 2014, Russia. Their RTS-index depreciated 43.04% over the course of the year. Russia's liquidity has come under a lot of stress as a perfect storm swept over key markets; The crash of the Rubble (-60.3% against the SDR), liquidity crunch in the financial sector and fiscal setbacks due to surpressed oil revenues.

Russian stock market performance
Russia RTS Index: -43.04% {source}

The United States

US broad market performance
S&P 500 Relative Performance {source}

S&P 500

In spite of frustrated bears and the end of QE, the (large cap) US stock markets kept marching on convincingly (+13.92%), albeit slower than in 2013 (+25.51%). The relative strength of the US economy allowed for a sustained bullish stance among investors, in favour of US equities and the Dollar.


Nasdaq Composite

US technology stocks even have shown better performance than the broad market. The Nasdaq Composite Index has gained  +14.39% and might challlenge the record from March 2000 (5048.62 index points) in 2015.
US technology stocks performance
Nasdaq Composite: +14.39% {source}

Russel 2000

The midcap index (Russel 2000) had been initially rangebound and appeared weakening. In the closing month of the year, the index finally pushed to fresh highs and ended on a positive note (+4.25%).  
US small cap performance
Russel 2000: +4.25% {source}

Volatility

Also in 2014, volatility had been suppressed for the greater part, except in the (historically volatile) October when the fear gauge peaked around 26. As the mild panic dispersed, bulls saw a window of oppertunity to allow fresh new highs and a redampening of volatility. On average, volatility has been slowly edging down since July 2012 and has averaged in the lower 14-range over the year.

US equities volatility chart
Multi-Year VIX (volatility) Index | 50 Week Moving Average {source}

Dow Theory

Dow theory market trend validator
Dow Transportation Average | Dow Industrial Average {source}
The classic Dow Theory regards the Dow Jones Transportation Average important confirmator for broad market performance. New highs within the Dow Jones Industrial Average should be confirmed by new highs in the Transportation Index.This is based on the idea that transportation companies' (like railroads, shipping companies and air freight carriers) performance are an accurate reflection of business conditions, since such companies connect manufacturers of goods to their customers. New highs in the Industrial Average, have been consistently confirmed by new highs in the Transportation Index. In this sense, the broad US stock has continued to confirm the bullish trend.

US broad market long-term performance
Historical Chart S&P 500 {source}

Japan

Japan broad market relative performance
Relative Gains Nikkei 225 {source}
Japan had a very decent year (+7.9%), but also considerably cooled down compared to the massive gains realised in 2013 (+52.17%). Japan has been fighting an uphill battle against a pervasive economic contraction and the effects of deflation. In recent years it has been expanding its monetary base aggressively to stimulate the economy and depreciate the Yuan. Although the curative effects of the monetary medicine seems to be waning off, Japan has pledged to increase the dosage in 2015 along with structural reforms.


If Japan continues to push onward, the Nikkei Index is bound to meet considerable overhead resistance at its 2007 peak at 18,252 Index Points.

Historical resistance Japan broad market
Historical Resistance Nikkei 225 {source}

Europe

European stock markets have shown an overall meagre performance (EuroStoxx 50 +0.88%). 'We are not Japan', has been echoing from Brussels and Frankfurt, although some commentators beg to differ.  The European mainland has shown questionable economic progress and political (in)action has handicapped the continent. With the absence of political reforms and weak underlying economic recovery, all eyes were directed at the ECB for actual financial catalysts. In this sense, Mr. Draghi has come surprisingly far with reiterations of his 'all that is necessary'-statement. With the use of narrative and interest rate reductions, the appreciating Euro reversed course and Government Bond yields have been drifting lower.

European exchanges have been showing a lot of action, but failed to get actual work done. The markets have been struggling to extend the upward trend and (in aggregate) has shown lower highs and lower lows since september. A lot of disparity exists between European markets, which makes establishing a single European trend difficult. Nevertheless, the 'singular' trend has been weakening and we should be on the lookout for trend (dis)continuations in stronger European markets (like Bel20, DAX, AEX).

European stock market performance
Euro Stoxx 50: +0.88% | Belgium: +12.06% | The Netherlands: +5.15% |
Spain: +4.62% | France: -0.86% | Germany: -1.15% (pure price index) {source}

Commodities

S&P GSCI Commodity Index

Commodities market performance
Relative Performance S&P GSCI Commodity Index {source}
For commodities, 2015 has been a terrible year (-33.12%). In hindsight, the precious metals crash in 2013 could have been interpreted as a prelude to widespread declines in commodities, which most profoundly hit the energy sector. This grand theme is famously dubbed as the end of the commodities super cycle; sustained pressure on natural resources pricing due to supply side expansions, efficiency and tepid economic growth projections. This premise has some notable exceptions. 

US Dollar Index


The US Dollar has been strengthening vigorously in the second half of 2014, which was widely considered a catalyzer for the commodities downturn. This interlocking exists simply because many centrally traded commodities are quoted (thus traded) against the US Dollar.

Dollar strenght catalyzes commodity weakness
US Dollar Index: +12.7% | GSCI Commodity Index: -33.1% {source}

Coffee and Live Stock

Coffee and livestock (+14.46%) were the outperformers in the commodities sector. Coffee has regained traction (+53.53%) after years of relative underperformance. Appreciations were mainly due to extreme drought in Brazil, world's largest coffee exporter. Impending shortages were quickly offset by record harvests in India, which kept some constrainment on prices.


Top performing commodity markets

GSCI Commodity Index: -33.82% | GSCI Live Stock Index: +14.46% | GSCI Coffee Index: +53.53 {source}

Metals

The metals as a whole also lost considerable ground (-6.24%) in 2014. Big losses were attributed to the precious metals (-5.0%) and industrial metals (-6.74%). Price developments in the industrial metals family has two faces, as nickle was the best performing metal (+6.65%) and aluminum did okay (+2.71%). However the widely reckonised probe for industrial and construction health, (Dr.) Copper, lost -14.36% over the year.


Comparison relative performance metals commodities
GSCI All Metals: -6.24% | Industrial Metals: -6.74% | Precious Metals: -5.0% | Nickle: +6.65% | Aluminum: +2.71% | Copper: -14.36% {source}


Uranium

Specialty metals fared reasonably well, with special regard for the rebound of Uranium (+15.7% from nov '13 - nov '14). This raw mineral, which is used for nuclear power generation, has seen invigorated attention since the Japanese approval for resumption of nuclear operations.

Long-term performance uranium
Multi-Year Price Development U3O8 (Uranium) {source}

Precious Metals

For the second year, the precious metals have met considerable headwinds. While 2014 started reasonably well for this metals group, with palladium as clear outperformer, the commodities slump that started in July ultimately dragged all precious metals down. This downturn led to a search for new bottoms and a difficult recovery for the precious metals. Platinum has underperformed (-12.32%) while Palladium fared reasonably well due to initial bullish momentum (+12.02%). Gold enjoyed fresh euphoria as the year started, but later had all market participants speculating about the formation of a new bottom. Gold ended relatively neutral (-2.31%), but it's silver sibling had a disastrous year (-21.20%). 


Relative performance precious metals commodities
Gold: -2.31% | Silver: -21.20% | Platinum: -12.32% | Palladium: +12.02% {source}

Gold & Silver Producers

Although some of the depreciations in bullion could be contained, miners in the metals sector couldn't escape a horrific year (-27.64%). The major miners in gold (-16.57%) contained the damage the best, whereas the juniors were butchered (-26.82%). The silver miners exhibited an inverse relationship, as juniors did a somewhat better job (-16.46%) than their mature peers (-20.31%). 


Relative performance gold and silver commodity miners
S&P Metals & Mining: -27.64% | ISE Junior Silver: -16.46% | Market Vectors Junior Gold Miners Index: -26.82% | Solactive Global Silver Miners: -20.31% | NYSE ARCA Gold Miners Index: -16.57% {source}    
ETFs are used as proxy for this chart and may exhibit tracking errors.

Energy

Most attention and disruption was attributed to declines in the energy sector (-46.06%). Losses were made across the board from gasoline (-47.60%) to US natural gas (-33.85%) and of course crude oil. The spread between West Texas Intermediate (WTI) and Brent Crude oil has tightened over the course of the year (from $12.10 to $3.62). The more US oriented WTI oil benchmark dropped -46.89%, which was surpassed by the a -47.95% drop in Brent.

Relative performance energy gas and crude oil
GSCI Energy: -46.06 | GSCI Natural Gas: -33.85% | GSCI Brent Crude: -47.95% | GSCI (WTI) Crude: -46.89% {source}


NOTE

This document is written for educational purposes only and does not constitute investment advice.
Actual performances and percentages may differ marginally due to the use of mixed data sources, rounding errors and the recency of data while writing this post (week 52-2014).

For a clean performance overview, pure price indexes are regarded (in contrast to Total Return Indexes) whenever possible, to isolate capital gains and losses while disregarding (dividend) reinvestments.

The effect of inflation and currency exchange rates (FX) on local markets can greatly influence relative performance.


1 October 2014

My Personal ETF Preferences

This article brings a personal summary of preferred ETFs.
The ETF toolset allows for tactical application of specific ETFs based on market expectations. Products, parameters and figures provided are primarily intended as mental note and no claim is made to the accuracy of data.

Using Exchange Traded Funds

As cycles and market oppertunities emerge, an ETF can be a great instrument to trade specific regions of the market. The Exchange Traded Fund (ETF) is an open-ended fund that tracks the performance of an index, commodity or any basket of assets and which trades like a stock. In this sense, ETFs can be used for oppertunity hunting, quick diversification and for hedging purposes. Be mindfull though, that not all ETFs are created even and specific types may suite a specific purposes. If you are relatively new to ETFs, or you want to refresh your knowledge, please follow one of these two links.  As goes with any investment, the prospectus always needs close examination before any capital is commited.

My Favorite ETF's

In the table below, an overview is given of my preferred ETFs, categorised by market and oppertunity (usage). Before making investments, always check the most actual conditions of the fund.


Underlying Asset
Exposure
Usage
Name
Ticker Code
Notes
S&P 500
1x long
Longer bi-directional moves
SPDR S&P 500
SPY
Higher expense ratio (0.09), solid tracking spread (0.01%).
1x long
Shorter bi-directional moves
Vanguard S&P 500
VOO
Lower expense ratio (0.05), slightly higher spread (~0.02%)
1x long
Longer-term bull market
Guggenheim S&P 500 Pure Growth
RPG
More volatile tracking of growth stocks at a higher expense ratio (0.35%)
2x short
Short-term bear market
ProShares Ultrashort S&P 500
SDS
Tight geared tracking at a moderate expense ratio (0.90%)
2x long
Short-term bull market
ProShares Ultra S&P 500
SSO
Geared tracking in a very liquid market at a moderate expense ratio (0.90%)
3x long
Short-term bull market
Direxion Daily S&P 500
SPXL
Very tight (levered) tracking at an medium expense ratio (0.99%)
Total US Market Exposure
1x long
Long-term bi-directional moves
Total Stock Market Speeder
VTI
Very low expense ratio (0.05) and an excellent spread (0.01%). Tracks Dow Jones U.S. Total Stock Market Index very accurately on a longer term base.
US Large Caps (broad market)
1x long
Medium to long-term bull market
Vanguard Mega Cap
MGC
Reasonable expense ratio (0.12%) at a very decent spread(avg) (0.04)
Dow-Jones - US Large Caps (Dow 30)
2x short
Short-term bearish moves
ProShares UltraShort Dow 30
DXD
High expense ratio (0.90%) and very tight tracking on daily base. Mind acute effects of compounding at high volatility resulting in quick decay.
Nasdaq-100
1x long
Medium-term bi-directional moves
Total Return Nasdaq-100
QQQ
Reasonable expense ratio (0.20%) with a tight spread(avg) (0.01%). This fund is only non-financial and largely overweight Apple.
1x long
Speculative tech growth.
First Trust NASDAQ-100 Equal Weighted
QQQEW
Quite high expense ratio (0.60%) with acceptable spread(avg) (0.08%). This fund equally weights Nasdaq-100 stocks and tilts to tech growth-stocks.
Volatility (VIX)
1x long
Short-term bull moves (bear markets)
iPath S&P 500 VIX Short-Term Futures ETN
VXX of VXZ
VERY DANGEROUS INSTRUMENTS, UNLESS SHORT. RELENTLESS COMPOUNDING LEADS TO MASSIVE DECAY IN BEARISH ENVIRONMENT. NEVER TRADE LONGER THAN 1 MONTH
1x short
Mid-term bear moves (bull markets)
VelocityShares Daily Inverse VIX Short Term ETN
XIV
Very high expense ratio (1.35%) and reasonable spread (0.03%) for short term. Use this asset at best in a mid-term downward market. BEWARE RISKS
WTI Crude Oil
1x long
medium term bi-directional moves
United States Oil
USO
Relatively low expense ratio (0.70%), reasonable tracking methodology. BEWARE VOLATILITY AND FUTURES CURVES
Brent Crude Oil
1x long
Medium term bi-directional moves
United States Brent Oil
BNO
Higher expense ratio (0.92%) at a reasonable spread(60) (0.09%)
GOLD
1x long (london fix)
Commodities (precious metals)
SPDR Gold
GLD
Decent expense ratio (0.40%) for a tight spread (60) (0.01%). Largest and most liquid gold tracker.
Juniors Miners
1x long
Medium-/long-term bull markets
Market Vectors Junior Gold Miners
GDXJ
High expense ratio (0.55%) and reasonable spread (0.12%) for a high profit potential in the (risky) Juniors gold miners complex.
1x long
Medium Term bull markets
Market Vectors Gold Miners
GDX
High expense ratio (0.52%) with reasonable spread (0.03%) short-term, but underperforms to HUI long-term.
Large-Cap Miners
3x short (HUI)
Short-term bear markets
Direxion Daily Gold Miners Bear 3X
DUST
High expense ratio (1.01%) for an agressive bet against gold miners on short term.
Silver
2x long (london fix)
Short-term bull markets
ProShares Ultra Silver
AGQ
Very high expense ratio (1.98%) and tight performance even when holding longer term. Most effective as short-term trading instrument.
2x short
Short-term bear markets
ProShares UltraShort Silver
ZSL
Very high expense ratio (2.02%)  but tight leveraged short-term tracking.
Financials (US)
1x long (SP500 financials)
Long-term bi-directional moves
Financial Select SPDR
XLF
Reasonable expense ratio (0.18%) and tight tracking over the long haul.
Utilities (US) {nutsbedrijven}
1x long (MSCI utiltities)
Medium-/long-term bi-directional moves
Vanguard Utilities
VPU
Reasonable expense ratio (0.22%) and solid tracking over the long term.
Consumer Staples (US)  {consumptie + huishoudelijk}
1x long
Medium-/long-term bi-directional moves
Vanguard Consumer Staples
VDC
Relatively low expense ratio (0.14%) and good tracking over the long term
Health Care (US)
1x long (MSCI Health care)
Medium-/long-term bi-directional moves
Vanguard Health Care
VHT
Relatively low expense ratio (0.14%) and good tracking over the long term
Biotechnology (US - Nasdaq)
2x long
Short-/medium-term bull markets
ProShares Ultra NASDAQ Biotech
BIB
Relatively high expense ratio (0.95%) and trading costs due to its spreads. Good choice for bullish speculations.
1x long
Medium-/long-term bi-directional moves
Guggenheim S&P Equal Weight Technology
RYT
Acceptable expense ratio (0.40%) for a reasonable tracking and equal weighting of S&P 500 tech companies.
Consumer Discretionary (US) {duurzame consumptiegoederen}
1x long
Short-/medium-term bi-directional moves
Consumer Discretionary Select SPDR
XLY
Attractive expense ratio (0.18%) but lacks tracking over a longer term. Liquidity and reasonable spread makes attractive trading tool for general market moves.
Energy (US)
1x long (MSCI Energy)
Vanguard Energy
VDE
Low expense ratio (0.14%), broad exposure and solid tracking spread(365) (0.07%). Second in market to a more liquid, but more S&P 500 inclined XLE.
Uranium
1x long
Medium-/long-term bi-directional moves
Market Vectors Uranium + Nuclear Energy
NLR
Reasonably high expense ratio (0.60%) for which it outperformed its peers. Reasonably liquid and relatively broad diversification.
Alternative Energy (Global)
1x long
medium-/long-term bi-directional moves
Market Vectors Global Alternative Energy
GEX
Reasonably high expense ratio (0.62%) and outperformance in bull-markets. Acceptable liquidity, but risks a high(er) spread.
Platinum
1x long
Medium-term bi-directional moves
ETFS Physical Platinum
PPLT
Relatively high expense ratio (o.60%), though lowest in segment. Acceptable tracking spread(12 Mo) (median -0.57%) and good liquidity.
Palladium
1x long
Medium-/long-term bi-directional moves
ETFS Physical Palladium
PALL
Only focussed physical palladium tracker, at relatively high expense ratio (0.60). Acceptable tracking spread (median -0.68%) and good liquidity.

The information is largely sourced from ETF.com and was last updated on Februari 2014. 

Short-term
Medium Term
Long-term
< 3 weeks
< 6 months
> 6 months

Some ETF Essentials

1) Levered Funds generally increase spreads (underperform) in volatile markets, but may outperform when volatility is low.
2) Commodity ETFs (based on futures and/or derrivatives) may underperform when in contango (futures-curve edges up) and outperform when in backwardation (futures-curve edging down). To check futures curves, you can check the latest contango report on ETF.com or parse data manually from the CME Group.
3) Synthetic (replicated) ETFs are constructed with (complex) derrivative structures, often opaque to the retail investor. Be mindfull of related risks and possible deviations in performance and spreads that result. You might want to prefer physical replicated ETFs.
4) ALWAYS be mindfull of volatility. Higher volatility increases likelyhood of underperformance.
5) Rebalancing / Compounding can be a b*tch! If you are using ETF's for the long run, make comparison charts yourself to get a sense of tracking variability (check this chart to see how a long VIX position using the VXX could explode in your face - even if you are right).
6) There is a difference between ETFs and ETNs (Exchange Traded Notes). In general, ETNs deliver better tracking performance, but bring substantial more (credit) risk. Check this article to learn more.


Using ETF's

When you are interested in wide exposure for an accessible price, then an ETF is an excellent choice. Before you make any commitments to sectors or markets, make sure you have selected the best value-for-money ETF that meets your strategy. You may can compare any ETF on www.etf.com and you may find additional information on www.morningstar.com. Before you make your first ETF investment, be sure to read these tips first.


Prosperous Investing,
Steven

11 June 2014

The Effects of ECB's Negative Depository Rates

Mario Draghi has lowered interest rates and marched into 'uncharted territory' by setting Central Bank depository rates to -0.10%. As a result, banks have to pay interest to store their cash at the ECB. This forces banks to push excess liquidity into circulation and into the hands of lenders, thus sounds the plan. Negative interest rates are not fully uncharted; Switzerland has used this policy tool aggressively in the '70s and the Swedish Riksbank and Danmark's Nationalbank even very recently. Although the Swedes haven't used this instrument in full effect, lessons can be learned from Denmark, who have recently ended their exercise.

Enter the Currency Wars

The most pronounced effect of negative interest rates  measure is to suppress currency exchange rates.
In order to curb the capital inflows that inflated the Danish Crone, the Bank of Denmark set their deposit rate to negative in July 2012. The large influx of money undermined their efforts to keep the Crone pegged to the Euro.


The ECB's Mandate

All of Mario Draghi's actions need to respect the ECB's principal mission. This is to keep inflation near 2%. Since the Eurozone faces a deflationary threat, drastic measures seem necessary and justified. The debasement of the Euro might stimulate possible drivers to inflation, but this is far from certain. This experiment may also backfire...

European citizens may already prepare for even lower interest on our savings. It is up to all actors within the Eurozone if riskier assets are preferred over low yielding savings deposits.

Problable Effects

So what does history tell us?
  1. Lower interest rates will be only partially passed through to consumers and to a larger extend to corporate deposits and/or service fees.
  2. Negative interest rates prove to directly affect currency exchange rates. 
  3. Chances for a credit crunch are as big (or slim) as changes for increased money flow.
  4. Government and asset backed bonds interest rates may decline.


Whatever the ECB is orchestrating, it's (un)intended effects are still to be seen.
"It is an axiom of central banking that the banking system itself cannot reduce the aggregate amount of its central bank deposits no matter how many loans are made because the funds loaned by one bank eventually are redeposited at another. Is it reasonable for the central bank to impose a tax on deposits held at the central bank when the central bank itself determines the amount of such deposits held by banks and the banking system? Perhaps these and other considerations caused European Central Bank President Mario Draghi in a recent press conference to label negative deposit rates "uncharted waters" and dismiss any possibility that the ECB would consider it."
- St. Louis Fed, januari 2013


Sources:
http://www.bankofengland.co.uk/research/Documents/ccbs/cew2013/presentation_lynggard.pdf
http://research.nordeamarkets.com/en/files/negative-rates-April13.pdf
http://www.stlouisfed.org/publications/re/articles/?id=2316

11 April 2014

De Aandelenmarkten Toegankelijk Gemaakt

Dit document heb ik ooit geschreven voor een goede kennis met interesse in de aandelenmarkten. Het vormt een basale inleiding om de aandelenmarkten in al haar mysticiteit tastbaarder te maken. Principieel moet ik elke blootstelling aan de aandelenmarkten afraden vanwege de omvangrijke risico’s. Er zijn veel specialisten die goede aanbevelingen kunnen doen omtrent jouw vermogensplanning. Wanneer je echter jouw nieuwsgierigheid niet bedwingen kunt, is de onderstaande aanpak een veilige manier om jouw investeringskeuzes te testen aan de marktrealiteit. Deze simulatie, bekend als paper trading kan simpel worden uitgevoerd zonder lastige oefenaccounts of een aanmelding bij een broker. Dit geeft rust en bespaart hijgende telefoontjes om die eerste storting…


Mijn Beleggingsfilosofie 


Beleggen kan op talloze manieren, met een veelvoud aan instrumenten en intensiteit. De perfecte methodologie is een afweging van talloze parameters en hoort te groeien met jouw persoonlijkheid en ervaring. Waarschijnlijk vormt jouw beleggingshorizon de allerbelangrijkste overweging. Met andere woorden, wanneer wil je winsten nemen en op welke frequentie wil je handelen? Ben je op zoek naar vermogensbescherming? Of wil je bijverdienen? Bij een passieve belegginswijze past een langere horizon, terwijl de spanne doorgaans verkort naarmate de houding actiever wordt. Mijn voorkeur gaat uit naar de lange termijn en ik bezie beleggingsbeslissingen graag in lijn met meerjaren-trends. Ieder ander - en zeker beginners - zou ik eenzelfde lange horizon aanbevelen, al is het om niet verloren te raken in de waan (koersen) van de dag. Een strategisch belegger met een lange horizon gebruikt een beurscrash om bij te kopen, waar een korte-termijn belegger veel geld ziet verdampen tijdens beurscrashes. Het rendementspotentieel is moeilijker te becijferen. Al decennia struikelen academici, experts, beleggers en handelaren welk tijdsraam het meeste rendement oplevert. Het gros roept dat buy-and-hold dood is en vele transacties per jaar lucratiever zijn. Echter laat Warren Buffet het actieve handelen over aan adrenalinejunks en bouwt gestaag en duurzaam aan zijn portefeuille, waarin hij zelfs nog posities heeft uit zijn beginjaren (30+ jaar). De ultieme portefeuille heeft een gewogen risico-/rendementsverhouding, welke zijn afgestemd op de persoonlijkheid (bloeddruk en levensfase) van de belegger. De defensieve belegger kiest voor veilig en duurzaam, terwijl de offensieve belegger kiest voor een risicovoller en kortstondigere jacht naar hogere rendementen. Natuurlijk loopt de defensieve belegger met een ‘veilig’ en gestaag appreciërende Unilever het volledige risico wanneer het bedrijf failliet gaat. 


De Juiste Belegging


Professionals stellen doorgaans brede portefeuilles samen rondom specifieke thema’s, met specifieke methodieken en doelstellingen. Binnen deze portefeuilles zullen de fondsbeheerders diverse beleggingsinstrumenten gebruiken voor een blootstelling aan de gewenste activaklassen en geografie. Een activaklasse (‘asset class’) staat voor de productfamilie waarin wordt belegd (vb. vastgoed of aandelen). De som van alle mogelijke investeringsinstrumenten heet effecten (‘securities’). Voor dit document kijk ik naar de activaklasse aandelen (‘equities’ of ’stocks’). Aandelen hebben normaliter betrekking op bedrijven. Weet dat bedrijven voor het aantrekken en renumereren van extern kapitaal separate fondsen oprichten. Derhalve zoek je technisch gezien het fonds Ahold N.V. en niet de rechtspersoon Ahold (Zaandam) B.V.


Portefeuillebeheer


Het beheer van de beleggingsportefeuille is wellicht het allerbelangrijkste voor een renderende toekomst. Ik durf zelfs te beweren dat ieder die faalt, dit doet vanwege slechte portfoliomanagement en niet zozeer vanwege slechte beleggingen an sich. Een portefeuille met louter rijzende sterren kan, onder slecht beheer, leiden tot persoonlijk faillissement. Terwijl deze twee jaar later mooie rendementen hadden kunnen opleveren. Dus als jij faalt, doe je dit omdat je jouw ‘zetten’ niet goed beheerst (in relatie tot je marge). Vaak hoeven we slechts de cyclus, of de dip uit te (kunnen) zitten om hogere toppen tegemoet te zien. Ik zal alle complexiteit besparen, maar wil graag aandacht vestigen op regel #1 binnen portfoliomanagement; diversificatie. En diversificatie kenmerkt zich door non-correlatie. Dit betekent dat de diverse effecten binnen de portefeuille een historische neiging moeten hebben tot ongelijke piek-dal momenten. Het precies tegenovergesteld bewegen van 2 effecten, duid op negatieve correlatie (-1) en is nog steeds correlatie. Een gezonde portefeuille is gediversifieerd in meerdere dimensies, met spreiding over activaklassen, geografische marktbediening, sectoren, bedrijfsomvang en meer. Een wijde spreiding binnen je portefeuille zet bij neergaande koersen niet je gehele portefeuille onder water (gedwongen noodverkopen door afgewaardeerd onderpand=’margin call’). Als het goed is valt er in alle 4-seizoenen zowel te oogsten als te zaaien.


De Beurs en het Aandeel


Elk beursgenoteerd bedrijf heeft een aandeelhoudersverplichting en zal op haar corporate websites (investor relations) informatie richting investeerders verschaffen. Bekijk deze secties en zorg dat je de relevante informatie uitspit om een goede beleggingscase te formuleren. Ongeacht welke informatie jij belangrijk vindt, zorg tenminste en te allen tijde dat je de PROSPECTUS hebt gelezen! En als er geen prospectus is, kies dan voor een andere belegging. 

Koersinfo & notering @ bmwgroup.com > Investor Relations


Exact dezelfde aandelen kunnen genoteerd staan aan verschillende beurzen (‘exchanges’). Door tijdelijke en lokale handelsfluctuaties kunnen op verschillende beurzen geringe prijsverschillen ontstaan. De markt zorgt in de regel voor het gelijktrekken van deze fluctuaties (‘arbitrage’). Zowat elk ontwikkeld land heeft één of meerdere beurzen, welke fysieke, virtuele of hybride handel kennen. De meeste van ons kennen Nasdaq (technologie georiënteerd), het welbekende New York Stock Exchange of onze hoogsteigen Amsterdam Stock Exchange (de oudste beurs ter wereld). Niet elke beurs heeft dezelfde betrouwbaarheid en liquiditeit, welke direct invloed kunnen hebben op hoe jouw order uitgevoerd wordt.


Aandeelinformatie @ bmwgroup.com > Investor Relations

Veel bedrijven hebben meerdere soorten aandelen, elk met eigen identificatiecodes (‘ticker codes’). De beurs van thuisland biedt vaak de hoofdnotering (‘primary exchange’). Hier is de handel veelal het meest liquide, hetgeen gunstig is voor de aan-/verkoopbaarheid alsook de spread (verschil bied-laatprijs). Moderne handelsplatformen dirigeren orders automatisch naar de beurs met de gunstigste condities. 


Marktdata


Bloomberg (VS) en Reuters (Europa) zijn de marktstandaard betreft informatieverschaffing binnen de financiële wereld. Zij bieden specialistische gereedschappen aan professionele marktpartijen en vormen een goed vertrekpunt voor de thuisbelegger (‘retail investor’). 


Zoek direct op bedrijfsnaam of op ticker symbol. In sommige gevallen is koersdata beschikbaar over het aandeel op meerdere beurzen. Het meest complete beeld kan vaak gewonnen worden door de bovenste optie te selecteren.  


Effecten selectiescherm @ Reuters.com


Het goed inspecteren van deze sites op jouw voorkeursbedrijven is werkelijk een must. Klik rond en kijk wat jij belangrijk zou kunnen vinden (en leer). 


 Aandeleninformatie @ Reuters.com

Fundamentele Analyse


Het nauwgezet onderzoek naar de (financiële) onderbouwing van markt en bedrijf staat bekend als Fundamentele Analyse. Deze analysevorm dient inzicht te verschaffen in het vermogen van een bedrijf om waarde te vangen, te leveren en af te zetten. Deze analyse richt zich derhalve op het bedrijf (aanbodzijde), met als doel om onderbenutte intrinsieke waarde bloot te leggen, maar ook op de markt als geheel (vraagzijde). Vervolgens moeten verkregen inzichten op realistische wijze worden geëxtrapoleerd naar de toekomst, met een gevoel voor marktontwikkeling, danwel consumententrends. Fundamentele Analyse is omvangrijk, maar evenzo belangrijk. Het uitvoeren van de goede fundamentele analyse en het wegen van de juiste metrieken mag jouw eerste stap naar zelfstudie zijn. 


Om je voort te helpen, kunnen we deze stelregels van meester Buffet in ogenschouw nemen;
  1. Wees de directeur van het bedrijf dat je analyseert en leer JOUW bedrijf kennen (nauwgezetheid).
  2. Overtuigd jezelf van het bedrijf en toekomstperspectieven in die mate dat je zelfs bereid zou zijn om jouw laatste € in het bedrijf te steken. (overtuiging)
  3. Een goede belegger (‘investor’) houdt niet van onzekerheden. (realisme)


Technische Analyse


De fundamentele analyse heeft inzicht verschaft in onderbenutte waarde in het verdienmodel c.q. bedrijf. Daarna volgt de technische analyse om (een) verstandig(e) instapmoment(en) te bepalen. We gaan naar de grafieken kijken, met andere woorden de prijs van het effect. Onthoudt dat waarde versloten ligt in het bedrijf, terwijl de prijs slechts in de hoofden van de observatoren (de markt) bestaat.

Welnu, tijd voor actie. Ik zal aan de hand van aandelen enkele voorbeelden doorlopen, zodat je vervolgens in Google Finance een fictieve portefeuille kunt opbouwen. Het samenstellen van een portefeuille kan met diverse tools, echter prefereer ik Google. De interface is licht/snel, het overzicht is goed, het combineert handig met het Google Account en het brengt mij een goed overzicht van relevant en actueel nieuws rondom de betreffende aandelen. 


Google Finance 

Vul in het zoekveld de bedrijfsnaam of de ticker symbol in. Google Finance registreert maar een beperkt aantal beurzen, ETR staat in dit geval voor de XETRA, welke de handelsplaats is van de Frankfurt Stock Exchange (hoofdnotering). 

Zoek Aandeel @ Google Finance


Indicatoren en Visuele Analyse


Vanuit de Technische Analyse kijk je louter naar koersen. Deze discipline beschouwd huidige marktprijs als de som van al het beschikbare nieuws en marktdynamiek. Dit is natuurlijk een voortschrijdend verhaal (lees: koersverloop). Begin ALTIJD vanuit het langetermijnbeeld voor overzicht over het strijdveld en het relativeren van de huidige marktprijs. Visuele analyse is één. Vervolgens maken Technisch Analisten veelvuldig gebruik van technische indicatoren. Als voorbeeld raad ik je aan om onder de grafiek ‘technicals’ aan de te klikken en EMA(200) te activeren. Dit is het lange-termijn (200-daags) slepend gemiddelde, welke ik bezie als een soort ‘fair value’. Duikelen we onder dit gemiddelde, beschouw ik het effect als ‘goedkoop’ en een beweging boven het gemiddelde beschouw ik als ‘duur’. Daarnaast verklappen koersbewegingen onder deze hulplijn een dalende trend en koersbewegingen erboven onthullen een stijgende trend. Begrijp dat dit niets zegt over de (on)aantrekkelijkheid van een aandeel. Immers had een koop in 2010, boven de EMA(200), over de jaren zeer lucratief kunnen zijn. Klik eens wat rond en ga zelf het experiment (en zelfstudie) aan. 


Voeg Technische Indicator toe @ Google Finance


Enkele tips vooraleer je het in-/uitstapmoment bepaald:
  1. De trend (stijgend/dalend) is wat altijd wat het is, totdat het tegendeel bewezen is.
  2. Een markt die niet stijgt, daalt.
  3. Markten kunnen voor aanzienlijke tijd over- of onderprijst blijven.
  4. Bevecht al jouw aannames. En de aanname onder deze aannames.
  5. Wees berekend op jouw ongelijk.
En ja, deze tips klinken als peuterwijsheid. Maar er komt een dag dat je terugdenkt aan wat hier geschreven staat…


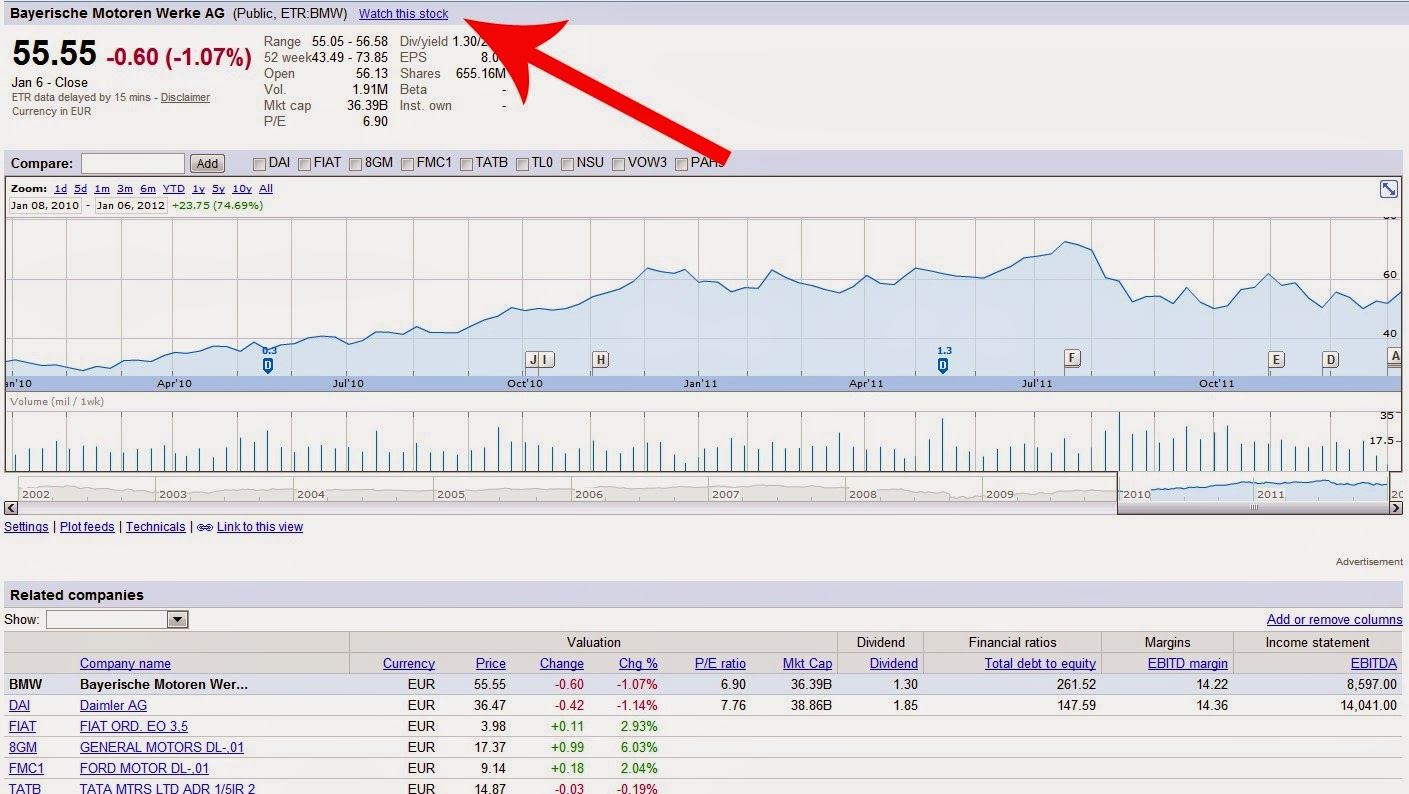
Bouw Jouw Portefeuille 


Speel, kijk en vergelijk. Wat zijn de historische aandelenkoersen, hoe hoog is het dividend en hoe verhoudt dit bedrijf zich tot branchegenoten? Vergeet het nieuws niet te bekijken/bij te houden. Wanneer je dit bedrijf wilt toevoegen aan je watchlist kies je Watch this stock

Assembleer jouw shortlist @ Google Finance


Onder My Portfolio bevindt zich de persoonlijke watchlist, voor een snel overzicht van alle, als interessant gemarkeerde effecten. Deze watchlist bouw je gemakkelijk om tot een volwaardige beleggingsportefeuille, door het toevoegen van transacties. 

 Portefeuille Transacties en Prestaties @ Google Finance

  1. Hier vind je de resultaten van de geselecteerde aandelen, al dan niet met persoonlijke winst-/verlies gegevens (alleen indien er transacties zijn toegevoegd).
  2. Hier kun je transacties toevoegen, ook in het verleden.
  3. Vergeet niet om de valuta op de €uro te zetten


Belangrijke Toevoegingen

Valutarisico

Indien je aandelen op buitenlandse beurzen koopt, reken je deze ook af in de valuta in kwestie. Deze valutatransacties gaan gepaard met variaties in euro/dollar-koers. Tevens kunnen voor deze muntconversie extra transactiekosten gerekend worden. Ook zal er, indien er nog geen Dollars in bezit waren, automatisch een rentedragende lening gesloten worden.

Bekijk de €/$ koers op http://www.google.com/finance?q=EURUSD

Transactiekosten
De transactiekosten moeten ook meegenomen worden (en kunnen in Google Finance worden toegevoegd). Bereken de kosten op basis van commissie over de totale transactiewaarde.

Voor overzicht van de Lynx tarieven, zie http://www.lynx.nl/php/TarievenLynx.pdf

Kopen is 1 transactie, maar verkopen (voor winstnemingen) is nog 1 transactie...

Margin Account
Rood staan kost geld. Met een klein beetje gemak handel je al onder hefboom. Dit speelt niet mee in je Google-account, maar wel in een echte omgeving. Het hiermee omgaan voegt een hele nieuwe dimensie aan het (portefeuille)beheer toe. Wanneer de onderpand zakt, is een groter component van jouw dekking onder nieuwe aankopen ingeleend (vreemd vermogen). Wanneer je echt gaat beleggen is het van vitaal belang dit mechanisme goed te begrijpen, of absoluut NIET met hefboom ('on margin') te handelen.

Oh, en mocht je initieel succes boeken (waarschijnlijk geluk en omdat de koers is gestegen om redenen die jij echt niet doorziet) en de Tony Montana in jou de overhand neemt;

Behaalde resultaten uit het verleden, bieden geen garantie voor de toekomst.

Enkele links
Investopedia is een waardevolle bron voor kennisverbreding omtrent beleggen. Zij bieden een simulator in een gesloten omgeving, waar je een gevoel kunt krijgen voor handel MET een beperkte portemonnaie. Ik heb geen ervaring met de tool, maar het kan interessant zijn.

Voor een overzicht beurzen per land, zie http://en.wikipedia.org/wiki/List_of_stock_exchanges


Alle in dit document genoemde voorbeelden vormen geen beleggingsadvies. De specifieke voorbeelden zijn louter bedoeld ter illustratie.